Anyone who’s ever monitored a network dashboard knows the feeling: that moment when data traffic starts forming a shape. Maybe packets spike, drop, then cluster in a tight band before the next move. It looks random until you’ve seen it enough times to know what’s coming next.
Market charts behave in a surprisingly similar way. Prices rise and fall in bursts, pause in predictable patterns, and then continue in the same direction. Traders interpret those pauses the same way IT specialists read signal congestion or latency bursts: as a temporary consolidation before the next major shift.
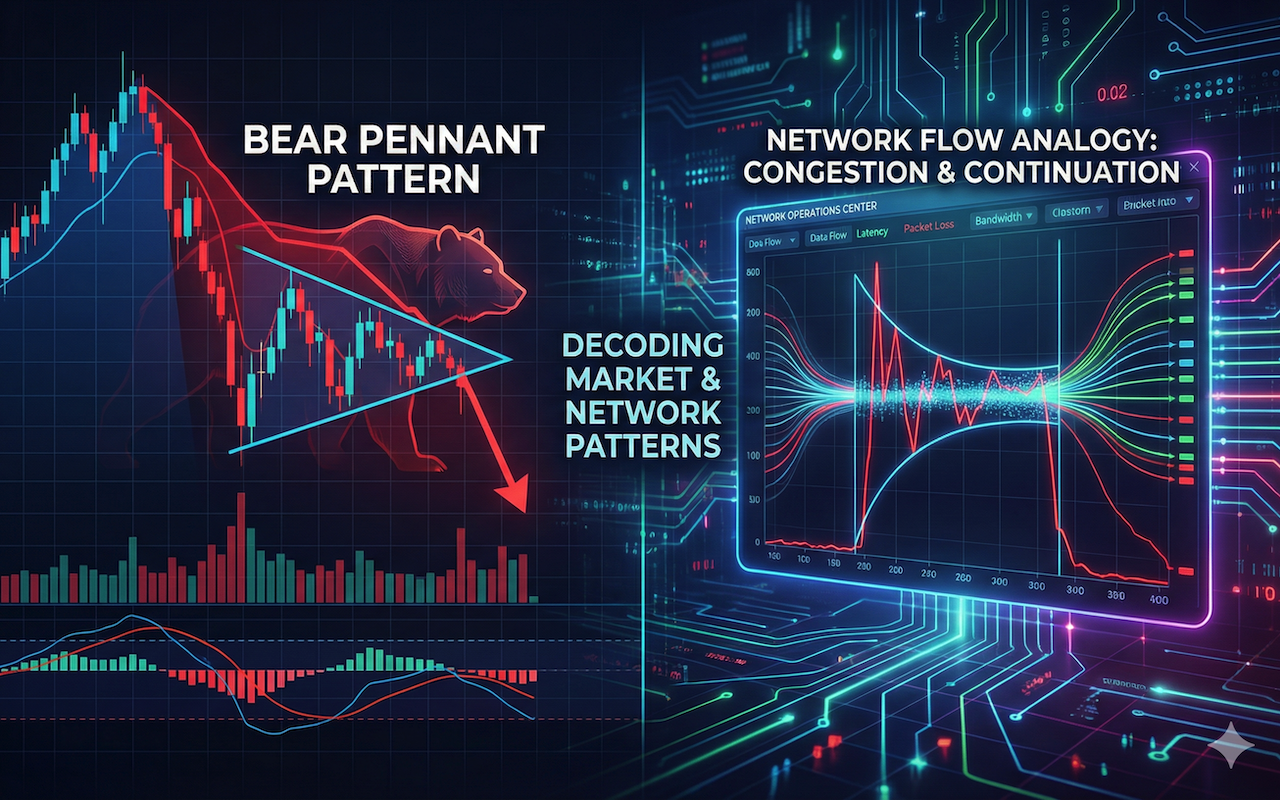
One of the cleanest examples of this logic in trading analysis is the bear pennant pattern. On a chart, it appears as a sharp downward move followed by a brief, triangular pause, which is a signal that momentum is resting, not reversing. Once that pause breaks, the price often continues in the same direction with renewed speed.
Reading Markets Like Network Flows
Network engineers don’t rely on gut feeling. They rely on pattern consistency. When traffic spikes or drops, they look for repeatable shapes that show whether the event is a blip or a sign of larger stress.
Traders do the same thing with price charts. Every candle, line, or bar is a data packet, containing information about sentiment, volume, and direction. Over time, those packets form structures that repeat enough to be statistically meaningful.
The pennant is one of those structures. It’s not defined by random noise, but by order forming after volatility, just like how network data stabilizes after a burst of heavy traffic.
What the Bear Pennant Tells You
The name “bear pennant” comes from its shape and its signal. The “bear” part reflects downward momentum; the “pennant” describes the triangular consolidation that forms afterwards.
Here’s how it typically unfolds:
- The Flagpole: A steep drop in price, driven by strong selling.
- The Pennant: A short period where price moves in narrowing highs and lows, forming a small triangle.
- The Breakout: When that triangle finally breaks lower, confirming the continuation of the downtrend.
If you mapped that on a network graph, it would look like a bandwidth spike, a short recalibration phase, and then another surge in the same direction. The same logic applies: the system hasn’t reversed; it’s just paused before continuing its flow.
How Data and Price Patterns Overlap
Both markets and networks behave like complex systems, comprising thousands of participants or nodes that react to pressure and flow. When you visualise that activity over time, patterns start to emerge naturally.
Consistent Structure
In network analysis, you see recurring shapes when traffic stabilizes after a surge. On charts, the pennant shape repeats for the same reason: it’s a reflection of temporary equilibrium.
Predictable Outcome
Engineers expect certain traffic responses based on prior events; traders use that same logic to expect continuation after a pennant.
Breakout Behavior
When pressure builds and breaks containment, both systems experience rapid movement, whether that’s a spike in packets or a new market leg.
This is why people trained in data science or network management often adapt quickly to chart reading. It’s the same skill set: pattern recognition grounded in logic and repetition.
The Psychology Behind the Pattern
Markets, like networks, represent the collective behavior of many independent agents. The bear pennant pattern emerges because traders, en masse, follow similar reactions.
After a sharp decline, some traders take profits while others wait to see if selling will resume. This creates a narrow range of indecision: the pennant. Once confidence returns, selling pressure overwhelms buyers, and the move continues.
It’s no different from a network under stress: after an overload, the system recalibrates, balances temporarily, and then continues to push traffic the same way until conditions truly change.
Understanding that behavior, not just the visual, is what makes the pennant useful. It’s a snapshot of how participants process information under pressure.
Pattern Reliability and Context
Like any signal, a pennant is only meaningful when it appears in the right context. On its own, it’s just geometry. Within a clear downtrend, it’s data with predictive power.
For example, a bear pennant forming on high volume carries more weight than one on light activity. In the same way, a network anomaly backed by multiple sensors is more reliable than a single data point.
The more confirmation you have, the stronger the inference. Traders often check other indicators, like moving averages, volume spikes, or volatility measures, to verify that the breakout aligns with the broader trend.
This layered analysis mirrors how IT professionals correlate alerts before diagnosing a network issue. One log entry doesn’t tell the full story; the combined pattern does.
Why Clean Data Still Wins
No matter how clever your models or algorithms, they’re only as good as the data you feed them. In trading, as in networking, a small error can warp the whole picture. Drop a few packets, and the graph looks broken; lose a few ticks of market data and a pattern can vanish or appear where it shouldn’t.
That’s why professionals care as much about the reliability of their feeds as the strategies they run. Stable connections and verified price data are what keep technical analysis honest.
Brokers such as ThinkMarkets build their systems with that in mind: consistent chart data, dependable execution, and access to the kind of information traders use to study formations like the bear pennant. With clean inputs, the analysis stands up. Without them, even the best tools are guessing.
How Traders Use the Bear Pennant
Experienced traders don’t treat the pennant as a signal to act instantly. They treat it as an alert, something that says, “Watch this area closely.”
Typical steps include:
- Monitoring volume to see if participation increases during consolidation.
- Waiting for a confirmed breakout below the pennant’s lower line.
- Checking for alignment with larger timeframes to confirm trend direction.
It’s a logic chain that would look familiar to any network engineer: detect → validate → confirm → act.
Because financial systems are as noisy as digital ones, discipline and verification are what separate signal from static.
Why Technical Patterns Still Matter in a Data-Driven Era
It’s tempting to think that AI or algorithmic trading has replaced classic chart reading. In reality, it’s made those skills more valuable. Algorithms now rely on the same geometric logic humans identified decades ago; they just process it faster.
Patterns like the bear pennant endure because they’re rooted in human behavior and mathematics. Even as systems evolve, the underlying psychology — reaction, hesitation, continuation — doesn’t change.
In a sense, these patterns are human fingerprints left on digital data. They tell us how groups behave when information flows fast and emotions run high.
Drawing the Parallel Clearly
Network specialists talk about “signal flow”; traders talk about “market flow.” Both describe how data behaves when influenced by pressure and volume.
Recognizing a bear pennant pattern is like identifying a short-lived drop in packet throughput before traffic resumes. It’s systemic. Once you’ve seen it often enough, it becomes second nature.
Understanding those recurring formations gives traders a framework to interpret volatility logically, not emotionally. For tech-minded readers, that should sound familiar: it’s exactly how you handle system data.
The Bridge Getting Stronger
The bridge between network analytics and market analysis keeps getting stronger. Both depend on detecting repeatable structures inside chaotic systems. Both reward precision, pattern memory, and context.
The bear pennant pattern is a perfect example of that connection: a temporary compression that signals continuation, built on predictable human behavior. Whether you work with packet flows or price feeds, the process is the same: gather the data, filter the noise, and recognize the shapes that matter.
Conclusion
The bear pennant pattern shows how financial markets often mimic the logic of network systems—reacting to pressure, stabilizing briefly, and then continuing in the same direction. By understanding these repeatable structures, traders can interpret volatility with greater clarity and confidence. Whether you're analyzing packet flow or price movement, the core skill remains the same: recognize the patterns, filter the noise, and let data—not emotion—guide your decisions.
Disclaimer
The information provided in this article is for educational and informational purposes only and should not be interpreted as financial, investment, or trading advice. Market patterns, including the bear pennant, involve risk and may not perform as expected under all conditions. Readers should conduct their own research or consult a licensed financial professional before making trading decisions.
While external resources or links may be included for convenience, iplocation.net does not endorse, verify, or guarantee the accuracy, security, or reliability of any third-party content. The website is not liable for any losses, damages, or issues arising from the use of external links or the information they contain.
Featured Image generated by Google Gemini.
Share this post
Leave a comment
All comments are moderated. Spammy and bot submitted comments are deleted. Please submit the comments that are helpful to others, and we'll approve your comments. A comment that includes outbound link will only be approved if the content is relevant to the topic, and has some value to our readers.
Comments (0)
No comment